- Data visualization
- Design systems
- AI prototyping
- Financial data
Redesigning stock quote pages at The Wall Street Journal
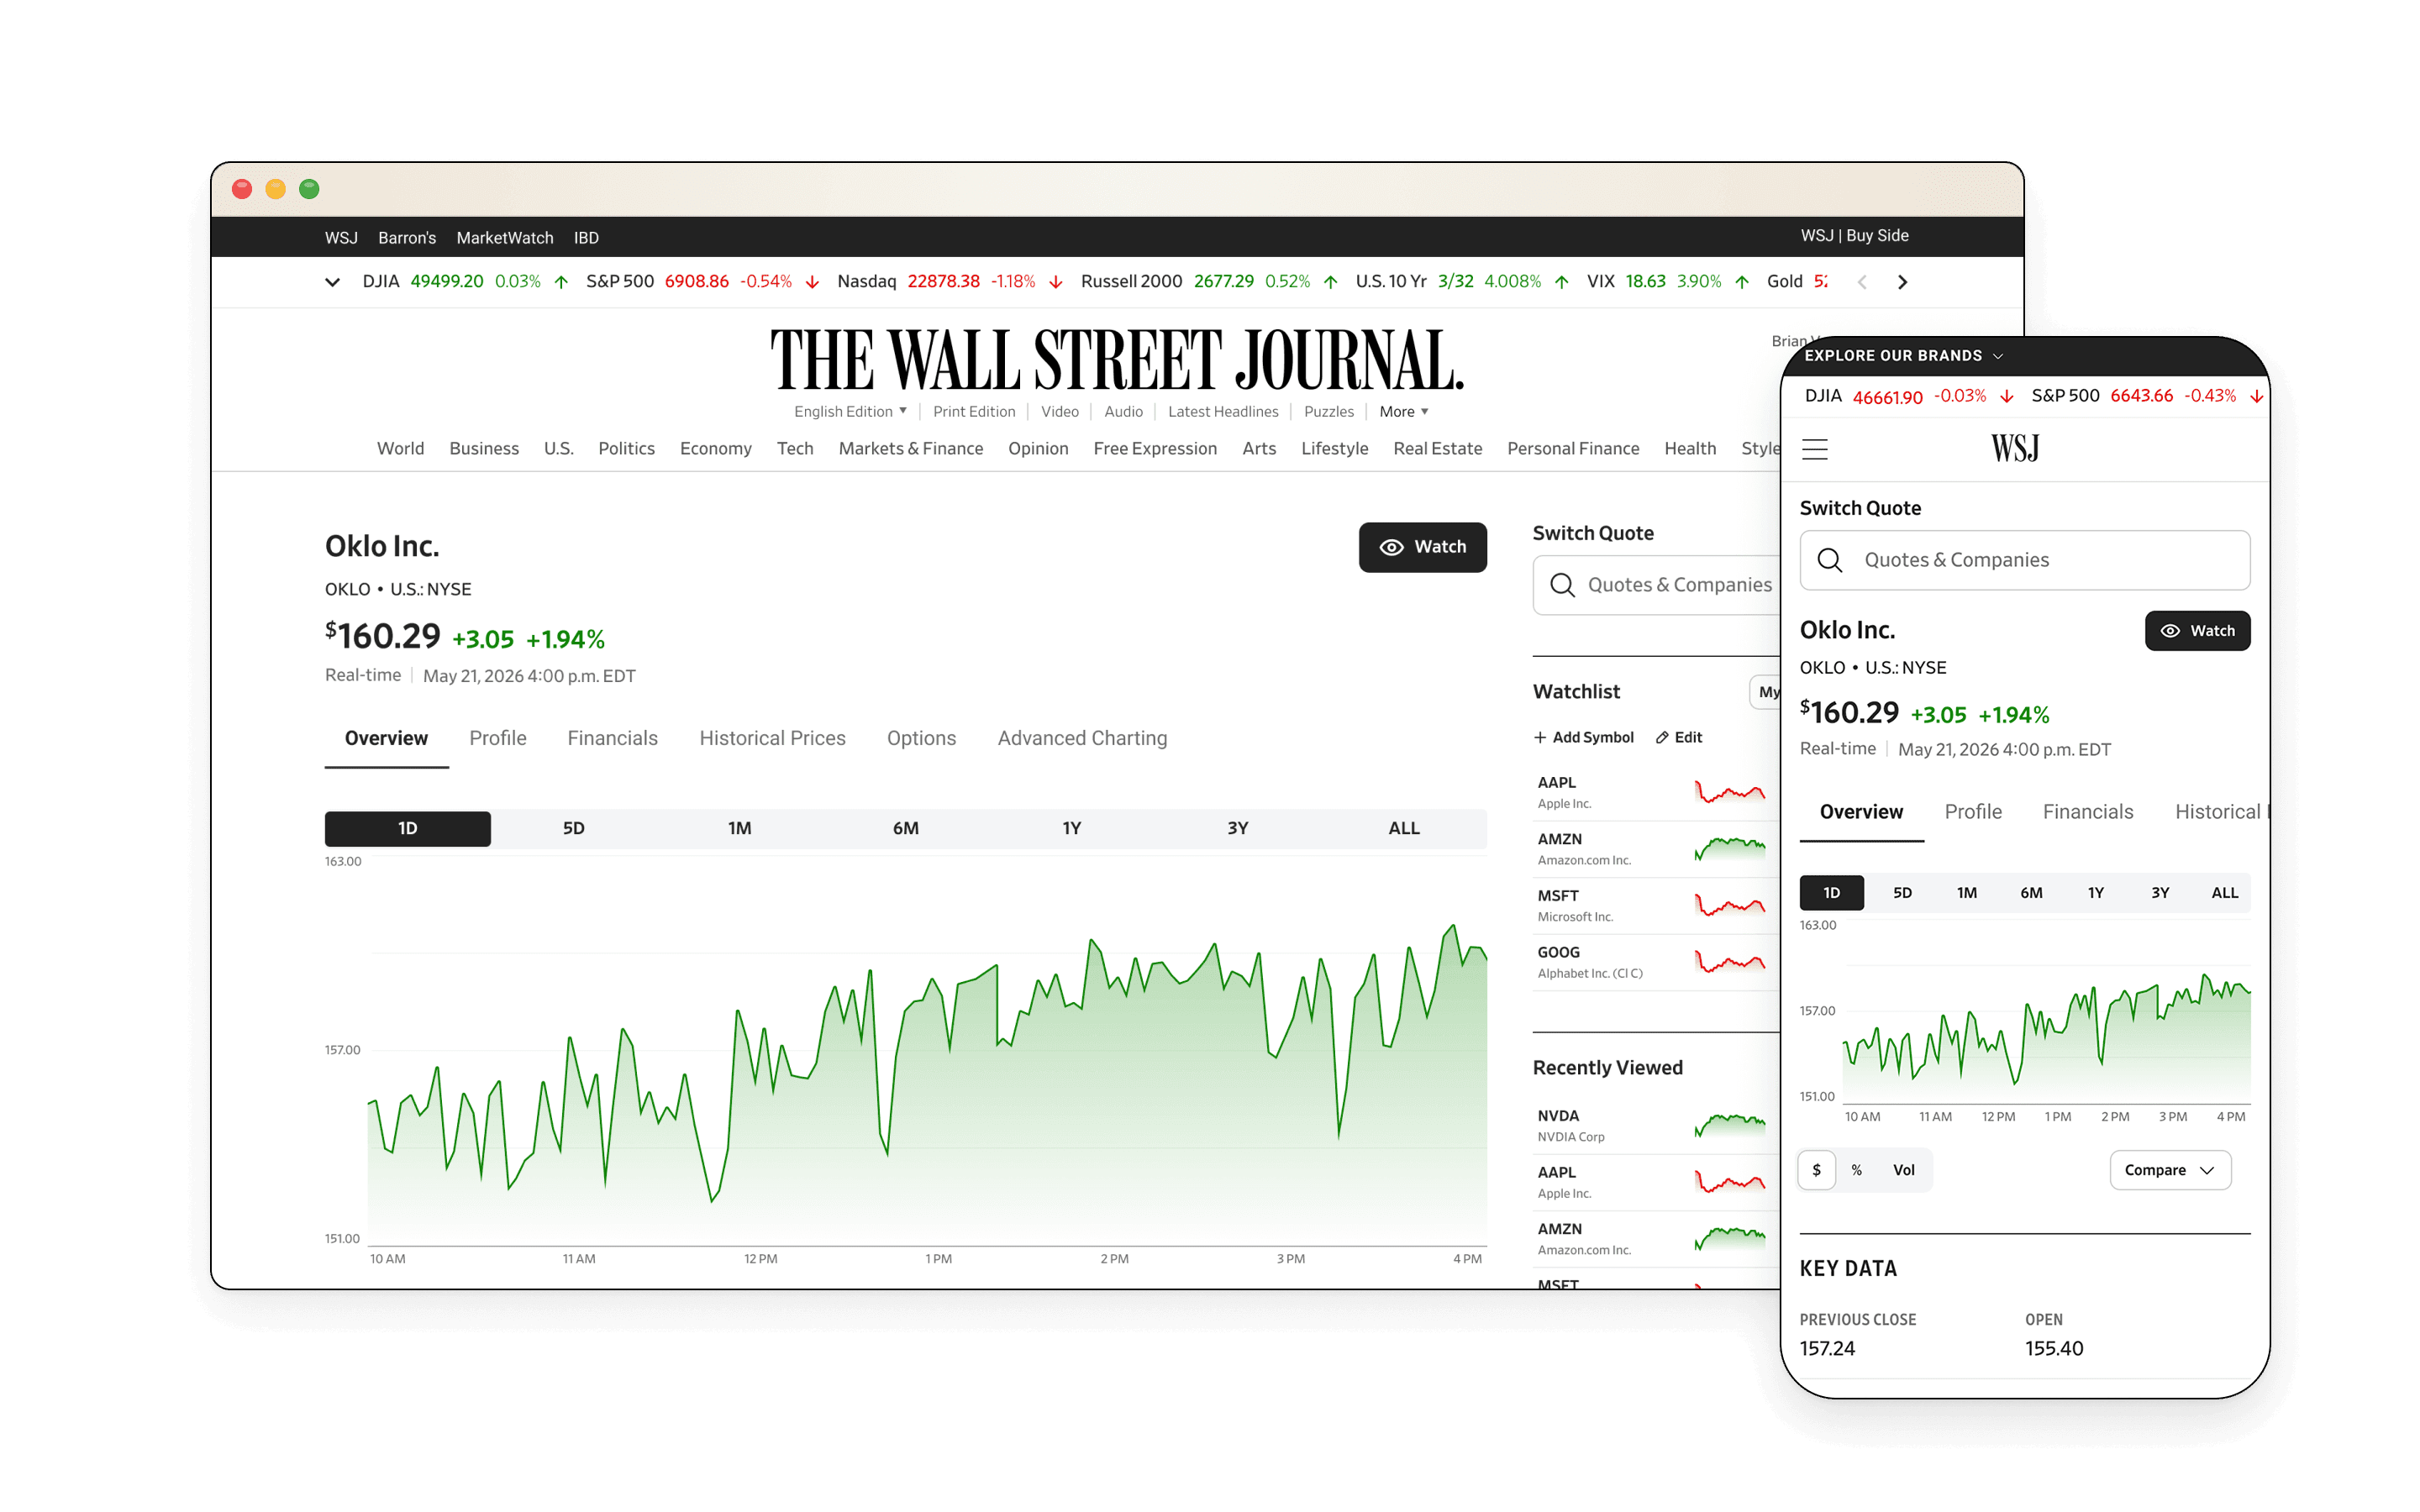
I redesigned the stock pages nearly a million WSJ readers a month use to make money decisions, and built them from components every Dow Jones brand can share.
- Role
- Lead Product Designer, Market Data
- Team
- PM partner, WSJ design and engineering, Dow Jones accessibility
- Timeline
- March to October · 6-week MVP sprint
- Scope
- WSJ and IBD quote pages, shared components for 4 brands
- pages live
- 10,000+
- MVP sprint
- 6 wks
- Dow Jones brands
- 4
Most of the job was juggling: two brands, a design system migration still underway, a six-week MVP, an app redesign to stay in step with, and engineers building while I was still designing.
Outcomes
Flatter architecture, mobile-first and live on 10,000+ pages
WSJ's Market Data center is one of the most heavily trafficked data hubs in financial media. WSJ trusted me with its quote pages, where institutional investors, day traders and everyday readers make high-stakes financial decisions every day. By mid-October, after I'd left, the redesigned overview tab was live for every US-traded stock, more than 10,000 pages including over-the-counter listings, following the milestones I set: overview first, then subpages, then indices, ETFs, bonds, forex and crypto.
- Shipped on plan. WSJ's design team, engineers and leadership said the rollout stayed on the milestones I'd set.
- A faster start for engineering. Developers built the page's scaffolding from my prototype instead of waiting on final specs.
- Ready for every brand. The new charts and modules live in the Market Data library. No other brand has used them yet, but any of them can pull a component and apply its own theme without a redesign.
- Built for the business goal. Stable pages, a flatter structure and a mobile-first layout were designed to win back the search traffic WSJ was losing to our other brands. I left before results came in.
Before
After
The problem
Two brands, two broken experiences
IBD readers had to visit three pages to research one stock: a quote page for IBD's proprietary ratings, a Stock Checkup page ranking it against its industry group, and a chart page that only made the price chart bigger.
“IBD is a maze of good information, but you have to dig or go in circles to find it.”WSJ had plenty of data, but it was buried and breaking. Nearly a million visitors a month hit pages that rendered badly, showed charts that looked broken, and sometimes returned a 404 straight from search. The competitors widget didn't work at all.
The structure made it worse. Tabs led to landing pages that led to more pages, and on mobile the key stock data sat behind an accordion. WSJ's quote pages also trailed our other brands in search, and we suspected why: crawlers had to dig as hard as readers did.
Accordion closed
Accordion opened
The real question
I owned the Market Data team's component library, so every chart I designed would become the standard for every Dow Jones brand. My earnings graph would be the earnings graph on every quote page.
That raised the question underneath the whole project: should every brand's quote page be the same template when each brand serves different readers with different goals?
Constraints
Designing while the ground moved
I came to the WSJ project as an outsider, a Market Data designer working in another team's system. And the ground was moving.
- A migration underway. WSJ was moving its tokens and components onto the global Dow Jones design system. Some components I needed weren't migrated yet, so I tracked those dependencies with WSJ's design and branding teams. Modernizing the front end was a goal, so I flagged early that WSJ's library needed the new global semantic tokens before I could use them, and that held up my work.
- Six weeks to an MVP. The project started as an experiment with a PM. When leadership moved it to the top of the list at the end of March, we planned to ship in increments: the overview tab first, subpages next, other asset types later.
- An app redesign in parallel. The WSJ app was redesigning its markets section at the same time. I kept the web pages consistent with it so we wouldn't build up design debt between the two.
- Engineers building alongside me. Developers built signed-off components while I was still iterating on others.
- New tools. We were learning Figma Make, Claude Code and Gemini in the middle of all of it.
Approach
A library of components, not one template
Each step built on the last: the IBD work earned me the project, a fast prototype got the team talking, the template debate set the direction, and then I designed the page change by change while keeping engineering in step.
Earning the WSJ project at IBD
IBD's consolidated quote page had been scrapped twice as designers turned over before it came to me. By then Dow Jones had acquired IBD, so I first mapped IBD's styles onto the global design system (that's the IBD Foundations case study).
Then I designed one page to replace the three, with new components, guided by user testing from earlier rounds. Leadership liked how I made IBD's dense ratings readable, and my manager asked me to take on WSJ next.
Quote
Stock Checkup
Chart
A working prototype instead of wireframes
We had a few ideas for WSJ, so I used Figma Make to get a mobile-web-first v0 in front of the team fast. It got us past the blank canvas and straight into talking about scope.
I treated AI like sculpting. Figma Make chiseled out the big chunks; then I moved to the Figma canvas to refine details and connect design tokens.
The prototype showed interactions that static frames couldn't, so we skipped low-fidelity wireframes entirely. Developers used it to start building the page's scaffolding weeks sooner than they otherwise could have. Getting it to look and behave right took more than 300 prompts.
Making the case against one template
My design manager proposed a single standardized quote page, modeled on the editorial article templates Dow Jones already used.
I pushed back. I'd just designed for IBD readers, who live in proprietary ratings and rarely open financial statements. Market research showed WSJ readers lean on macro economic data, historical earnings and analyst estimates. Same stock, different questions.
So I proposed a library of quote page components that each brand picks from and themes as its own, inside the global design system. That argument won, and it shaped every decision that followed.
Design
An overview that answers most questions without leaving it
The new WSJ overview page answers most questions without leaving it, and nothing sits deeper than one subpage. Four changes did most of the work.
1. A flatter structure, mobile first
- No in-between pages. Financials used to open a landing page you clicked through to reach cash flow or the balance sheet. Now nothing sits more than one level down.
- A consistent nav. No more one-off dropdown menus in the secondary nav. On mobile web, a horizontally scrolling bar replaced the dropdown modal.
- Signposts on the overview. Section callouts lead into subpages: a financial snapshot into Financials, the company description into Profile.
- Fewer tabs. I moved analyst ratings and price targets onto the overview and retired the Research & Ratings tab.
- A price that stays in view. On mobile web, a compact quote header sticks to the top as you scroll, so readers can watch the price move while they research. Competitor sites already did this, and so did another Dow Jones brand.
Readers find things faster, and search crawlers no longer have to dig.
Before
After
2. A price chart built for comparison
- Accessible by default. With the accessibility team, I chose a colorblind-safe palette for comparison lines and gave each line a differently shaped endpoint, so color isn't the only cue.
- A fixed values table. I replaced the tooltip that followed the cursor with a table beside the chart, so readers can compare prices and changes as they hover.
- Comparison on mobile. Mobile web didn't offer stock comparison before. Now it does. Touching anywhere on the chart brings up the crosshair, so readers don't need to hit a thin line.
Desktop
Mobile
3. Earnings charts that each say one thing
The old visualizations mixed forecasts with actual results, and their tables didn't connect to the graphs. I split them apart.
- Earnings vs. estimates. A simple chart showing whether the company beat, met or missed estimates each quarter or year, plus the next two estimates when available. It barely changed in critique.
- Estimate trends. A separate chart of high, low and consensus estimates today, one month ago and three months ago, toggleable between quarterly and yearly. I started with a shaded range band and a connected consensus line, then switched to vertical bars with a consensus dot inside each: these are snapshots at three fixed points in time, and a line implies data between them that doesn't exist.
- Financial snapshot. Early versions had bar charts for income and cash flow. That was too much for an overview, so I cut it to a snapshot table and price performance that point readers into the subpages.
First version
Final version
4. Analyst ratings and price targets up front
- Ratings that scan. Every Dow Jones brand showed analyst ratings in a single color, which made them hard to tell apart. I gave each its own: green for Buy and Overweight, black for Hold, red for Underweight and Sell. A portfolio analyst might call that misleading, since Buy isn't strictly a "good" signal, but we argued retail investors mainly need to tell the bars apart at a glance, and green and red are the convention they already read.
- Price target, in three tries. The first version, a point on a horizontal line, looked like a slider people would try to drag. A tooltip version came next, but it broke whenever the current price sat outside the analysts' range. The final chart shows the last 12 months of price, then fans out into the range of estimates for the next 12, so you can see where the targets sit against today's price. We also tried green and red in the callout version to show whether the average target sat above or below today's price, but the color only made sense once the fan chart showed that direction on its own.
First version
Final version
The system underneath
Every element is tied to existing tokens. New components went into the Market Data library with documentation, so Barron's, MarketWatch or IBD can drop them in and apply their own theme.
Components
Quote header states
Before I left, I also designed the Historical Prices, Profile and Financials subpages.
Process
Iterating fast without leaving engineering behind
Iterating on charts with AI as a thought partner
When I got stuck on the data visualizations, I used Claude and Gemini to build interactive artifacts, like charts with real hover behavior, and tested them with internal teams to see what worked. Claude was most useful when I came in knowing exactly what the data needed to say. Many of our final chart decisions came out of those sessions.
The charts changed several times after critique, which made the next problem harder.
Keeping engineers on the current version
With developers building while I iterated, the risk was someone building last week's design. Some of them didn't have Figma Dev Mode, so I made the case to get them access. Then I used it like version control: components marked "Ready for dev" lived on their own page, apart from the ones still in progress, and every change after a critique was flagged so the right developers were notified. Looking back, I was making design commits. We also met daily, and I kept track of which Figma Make prototype was current. That's how engineering built the page while I kept refining it.
Testing an agent on the canvas
I also wanted to see whether an agent could design directly in Figma. This was before Figma released its own agents. I connected Claude Code to Figma's MCP server in VS Code, pointed it at the Dow Jones design system and brand libraries, and told it to use only established tokens, never hard-coded values, and to check its work with screenshots.
It drafted the Profile and Financials subpages, but the drafts were rough. Some tokens were misapplied and some fonts didn't render, because each brand was at a different stage of its migration. The agent was only as connected as the system it was pointed at.
Still, those drafts gave me starting concepts to refine and bring to the team.
Agent draft
Final design
Reflection
AI roughed out the stone. I carved the details.
What I learned
AI is best at the big cuts. Figma Make and Claude got us from a blank canvas to something the team could react to and argue about. The finer work, like wiring up tokens and deciding exactly what a chart should say, still needed me on the canvas. And an agent is only as reliable as the design system it's pointed at. It's also why the IBD Foundations work mattered: the cleaner the system, the more an agent can do with it.
What I'd do differently
This was my first real experiment with AI in my workflow, and I'd spend my Figma Make credits more wisely. I learned late that I could match the model to how complex a prompt was. And I was prompting for tiny tweaks I could have made faster with point-and-click edits on the canvas.
I'd also put the prototype in front of real customers, even just for high-level feedback, to check that the new data visualizations made sense to them. Our newly formed UX research team already had a full backlog, so that step never happened.
Finding it live
In October, after I'd left, I found out WSJ had shipped the stock overview tab on the milestones I'd set. It was a thrilling, bittersweet moment to see our hard work come to life. I'm excited to see how the rest of the quote pages take shape on the foundation I laid.